How to add charts?
There are types of charts in Animiz built-in library, including a radar chart, a pie chart, a bar chart a line chart and so on. You can use these charts to visualize the data and convey information clearly. Here are the steps:
Add chart
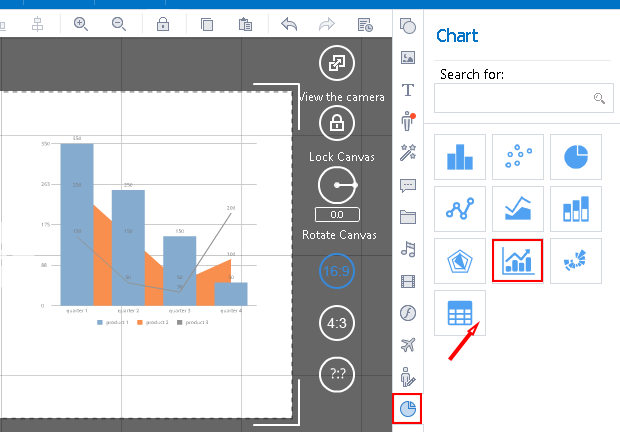
Way 1
Click the "Chart" icon--select one chart in the library.

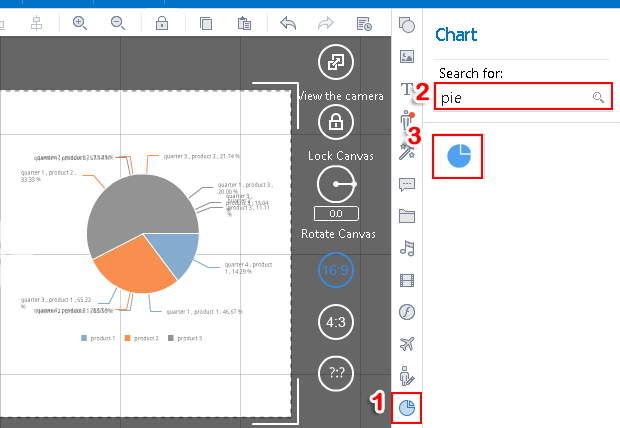
Way 2
Click the "Chart" icon, type the chart type in the search bar, and then click the chart to add it.

Edit chart
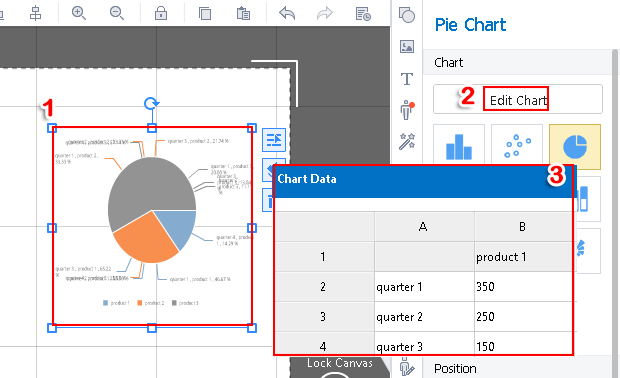
After adding the chart to the video presentation, you can follow steps below to edit the chart information.
Select the chart that you have added, click “Edit Chart”,and then you will see a window pop up.

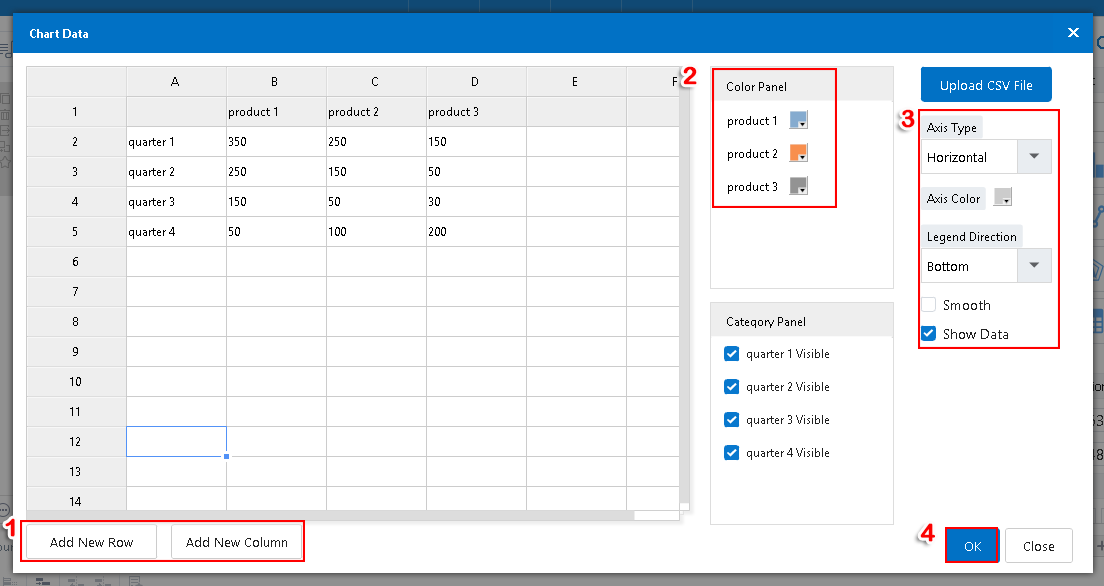
In this window,you can add new rows and column, customize color panel, axis type,axis color and so on. After making these editing, click “OK” to apply them.
Previous:How to add symbols?
Next:How to add actor?


